There are times when you want to embed certain blockchain data on your websites.
For example, you have a token and you want to showcase its price or latest transfers.
But you don’t know how to code.
Therefore, we have built widgets for you.
We provide simple HTML code, which you can embed to enable blockchain data visualization on your website.
Let’s understand how this is possible using Bitquery Widgets.
How to find the data you are looking for?
Before creating any visualization, you need to find out the data you are looking for.
The best place to look for the data is our Explorer , you should always start with our explorer.
You can search your token, wallet or transaction, or any other smart contract or blockchain-related things and see what data we provide.
For example, let’s say you want to show daily transfers trends for the Shiba token. Shiba exists on the Ethereum chain and its address is 0x95ad61b0a150d79219dcf64e1e6cc01f0b64c4ce.
Now when you search this token on our explorer , you will see a lot of data related to Shiba.
Shiba token details
As you can see there are a lot of details related to the token, and you can also see Shiba’s transfers at the bottom left.
Now, let’s say you want to add a similar widget to your website.
You can accomplish this with our GraphQL IDE.
To open this widget, click on the Open GraphQL IDE on the bottom right.
This will open the GraphQL query on the which is getting that data.
Shiba token transfers
Make sure you get signed up on our GraphQL IDE.
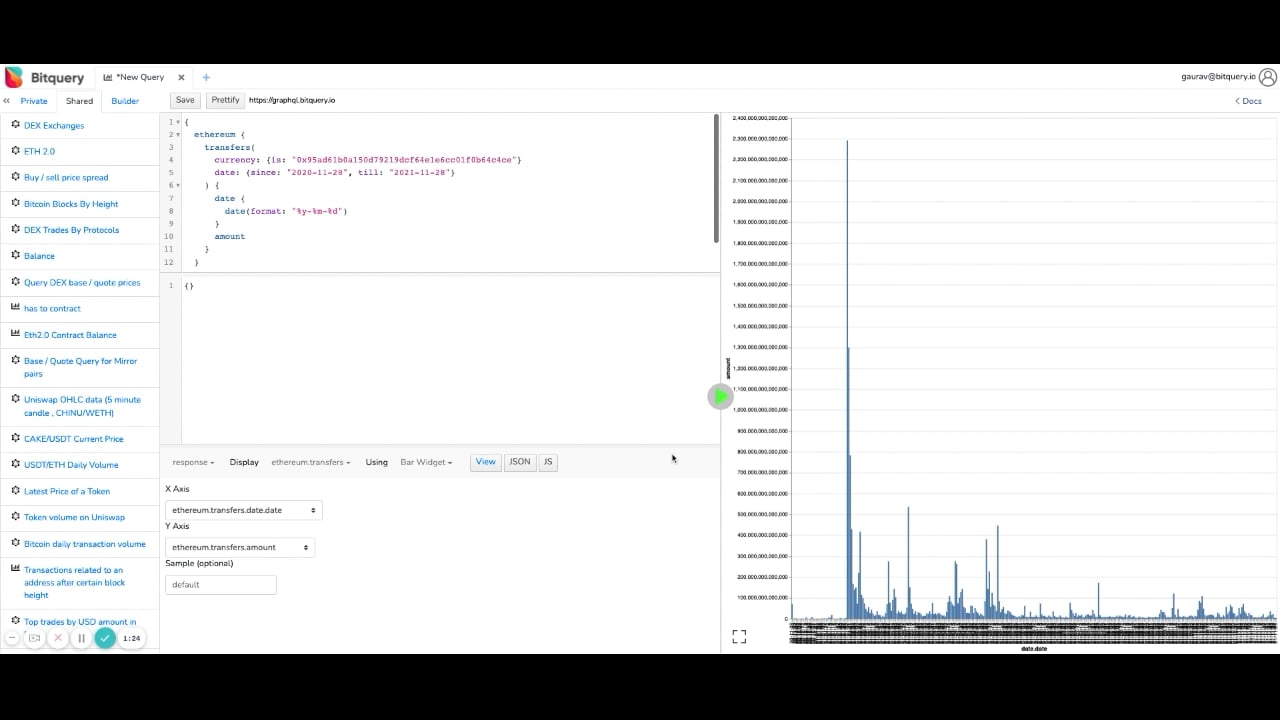
Visualize Query Result
Now you can visualize any query result using our GraphQL IDE.
Check the following video.
You select the option of the bar chart to get the visualization.
Bar chart option
You will see the following visualization once you select the option of the bar chart.
Now if you notice, you will a JS button on the screen.
This JS button will give you HTML code which you need to embed on your website.
HTML Code for the widget
Getting Tradingview Chart
You can also get the Tradingview chart for any token.
For example, check this query where we are getting OHLC data WETH-SAITAMA trading pairs to visualize it as a Tradingview chart.
Note: To visualize OHLC data as a TradingView chart, there should be “open”, ”low”, ”high” and “close” data points in the result.
You can click on the JS button to get the HTML code for Tradingview.
Use our APIs and build Widgets
You can write GraphQL queries to get any type of blockchain and visualize them through our GraphQL IDE.
Read this guide on how to get started with Bitquery APIs .
Currently, we support more than 40 blockchains.


